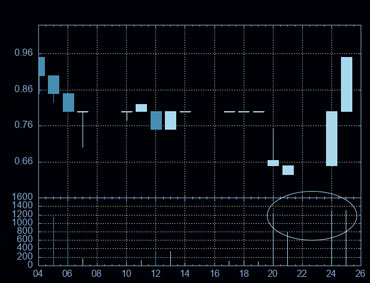
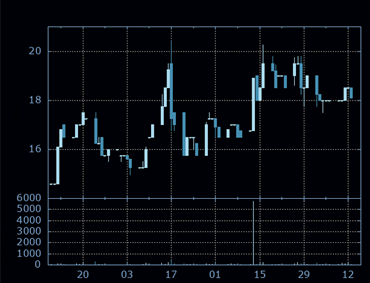
innerBanner

Chart Patterns


  • Signup to receive email alerts when any combination of chart patterns occur.

  • Receive email notification if a U.K company closes at a one/two/three year low with unusually large volume and a doji.

  • Use our 3 month low email notification to help reduce the costs of drip feed investing.

  • Access All chart patterns and configure email alerts with a 7 day FREE trial

  • offerImg
  • One Year Low
  • Two Year Low
  • Three Year Low
  • Highlighting stocks at or below a yearly low.

    offerImg
    High volume

    Highlights stock where today's trading volume is 150% of average daily volume.

    offerImg
    Ascending triangles

    A bullish continuation pattern indicative of increased buying pressure. The rising lower trendline provides cheap entry points before the pattern completes and a breakout occurs.
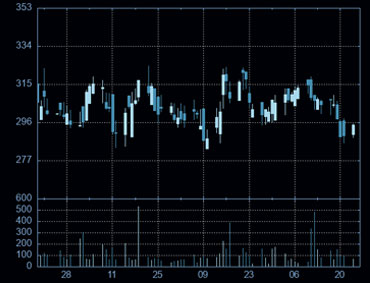
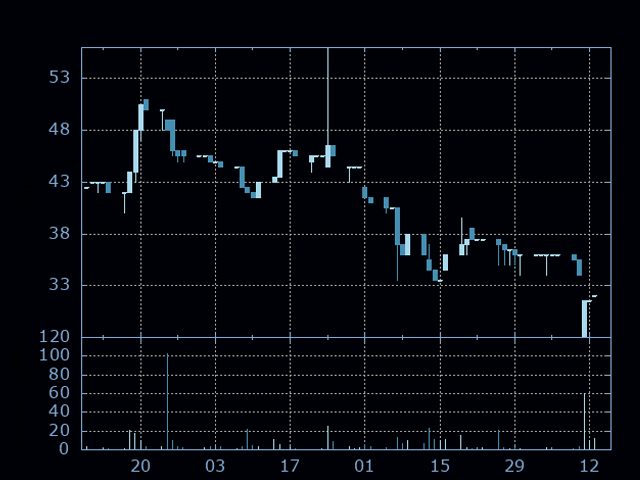
    offerImg
    Trading range

    This pattern shows stocks that have traded horizontally within a defined range of at least 9% over the last three months. It lists stock where the price is currently <= 3% from the bottom of that trading range.
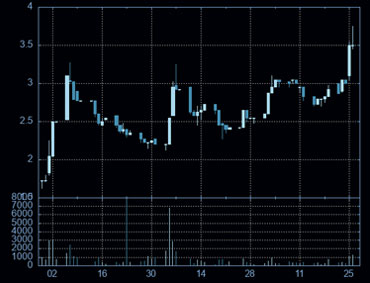
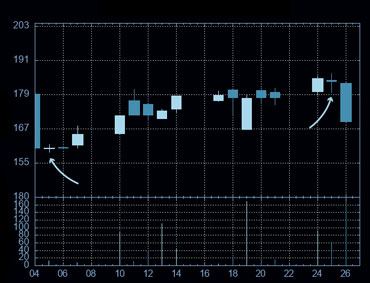
    offerImg
    Breakouts

    This pattern detects an upside breakout in a stock from a previous flat line.

    offerImg
    Upward Trendline

    Three months data are displayed. Stocks that show an upward trending channel over the last 6 weeks are listed.

    offerImg
    Dojis

    The Doji candlestick pattern shows indecision in the market and can help set buy and sell points.
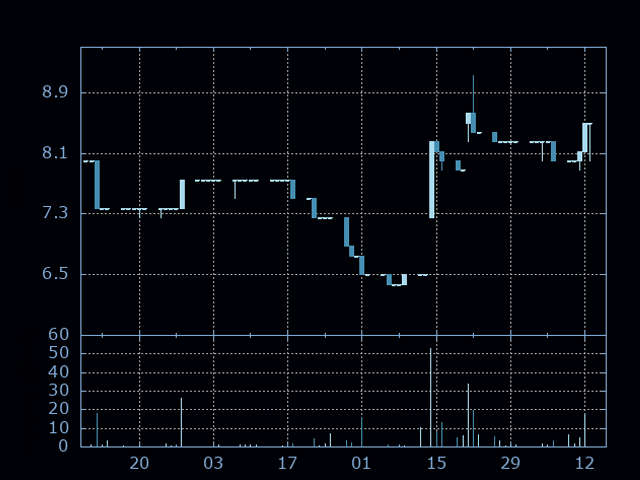
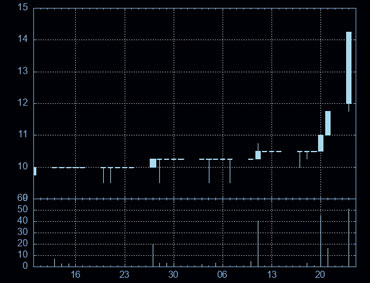
    offerImg
    3 Month Low

    This pattern lists stock where the current price is <= 3% from the 3 month low.

    offerImg
    3 Month High

    View hot stocks and sectors at a three month high. This algorithm lists stock where the current price is <= 3% from the 3 month high.

    Copyright © 2023 propatterns.co.uk - All Rights Reserved