Home
UK Data
Upcoming Dividends
One Year Low
Two Year Low
Three Year Low
High Volume
Three Month High
Three Month Low
Short Term Ascending Triangle
Long term Ascending Triangle
Trading Range
Upward Trendline
Breakouts
N.Doji
S.Doji
Golden Cross
Death Cross
US Data
Upcoming Dividends
One Year Low
Two Year Low
Three Year Low
High Volume
Three Month High
Three Month Low
Short Term Ascending Triangle
Long term Ascending Triangle
Trading Range
Upward Trendline
Breakouts
N.Doji
S.Doji
Golden Cross
Death Cross
Pricing
News
Login
Search company
Code
Company Name
US:Breakout List
Updated 30/07/2026
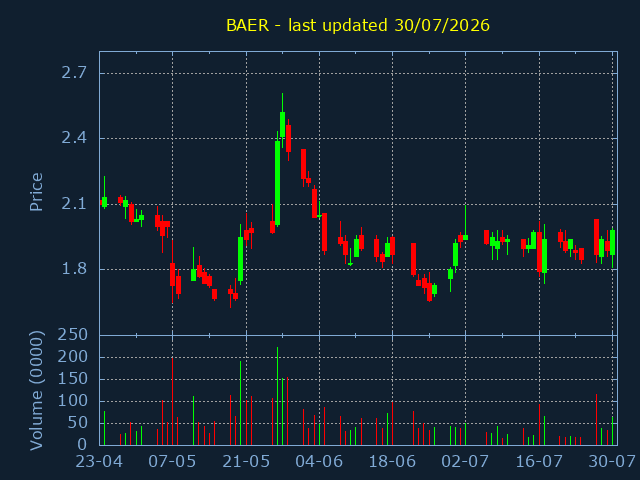
BAER - Bridger Aerospace Group Holdings Inc. Common Stock
Sector:
Volume:640,042 - vs daily avg (164%)
Current Price:1.98, +0.090, +4.76%
Approx. USD. traded today:12,672
Click here for BAER Candlestick History
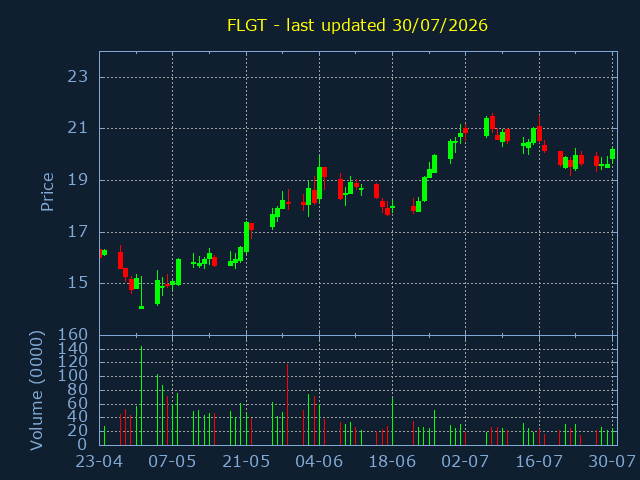
FLGT - Fulgent Genetics Inc
Sector:
Volume:250,641 - vs daily avg (105%)
Current Price:20.21, +0.570, +2.90%
Approx. USD. traded today:50,654
Click here for FLGT Candlestick History
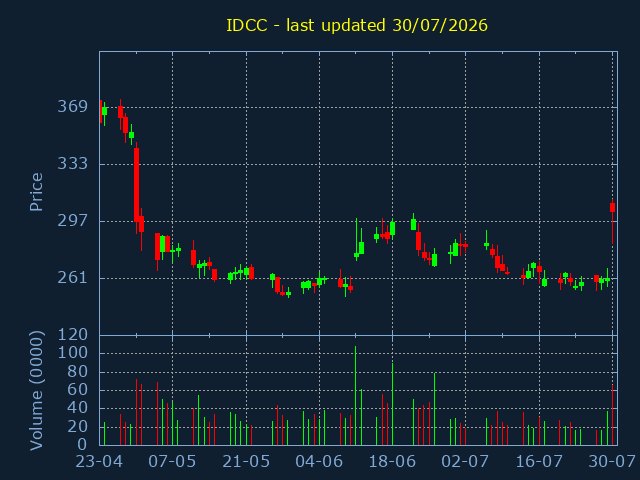
IDCC - InterDigital Inc
Sector:
Volume:655,406 - vs daily avg (248%)
Current Price:303.33, +42.200, +16.16%
Approx. USD. traded today:1,988,043
Click here for IDCC Candlestick History
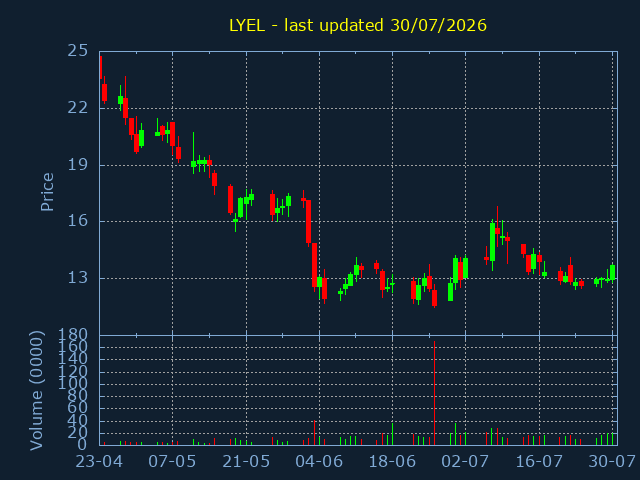
LYEL - Lyell Immunopharma Inc
Sector:
Volume:195,960 - vs daily avg (119%)
Current Price:13.72, +0.750, +5.78%
Approx. USD. traded today:26,885
Click here for LYEL Candlestick History
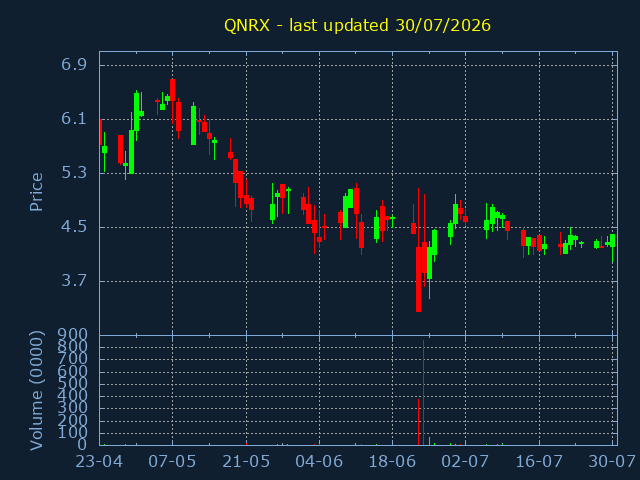
QNRX - Quoin Pharmaceuticals Ltd DRC
Sector:
Volume:39,838 - vs daily avg (158%)
Current Price:4.4, +0.125, +2.81%
Approx. USD. traded today:1,752
Click here for QNRX Candlestick History
Copyright © 2023 propatterns.co.uk - All Rights Reserved
Terms And Conditions
Privacy Policy