Chart Pattern
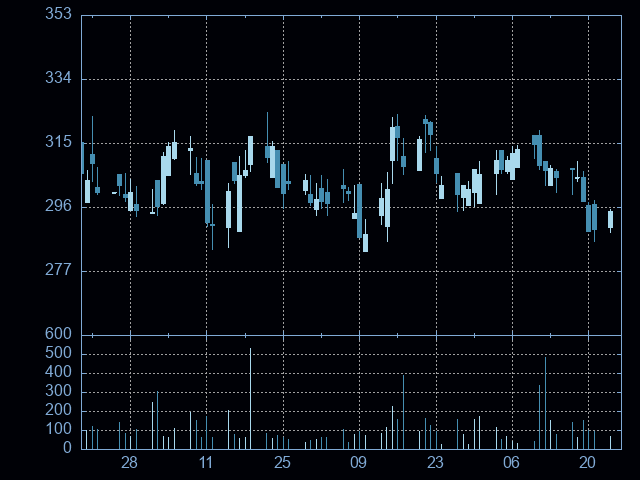
Trading Range
This algorithm identifies stocks that have traded like a sine-wave horizontally within a defined range of at least 9% over the last three months.
It lists stock where the price is currently at the bottom of that trading range.
With the added consideration of volume and candlestick analysis you can reduce risk trading within these ranges.