Home
UK Data
Upcoming Dividends
One Year Low
Two Year Low
Three Year Low
High Volume
Three Month High
Three Month Low
Short Term Ascending Triangle
Long term Ascending Triangle
Trading Range
Upward Trendline
Breakouts
N.Doji
S.Doji
Golden Cross
Death Cross
US Data
Upcoming Dividends
One Year Low
Two Year Low
Three Year Low
High Volume
Three Month High
Three Month Low
Short Term Ascending Triangle
Long term Ascending Triangle
Trading Range
Upward Trendline
Breakouts
N.Doji
S.Doji
Golden Cross
Death Cross
Pricing
News
Login
Search company
Code
Company Name
US:Death Cross List
Updated 30/07/2026
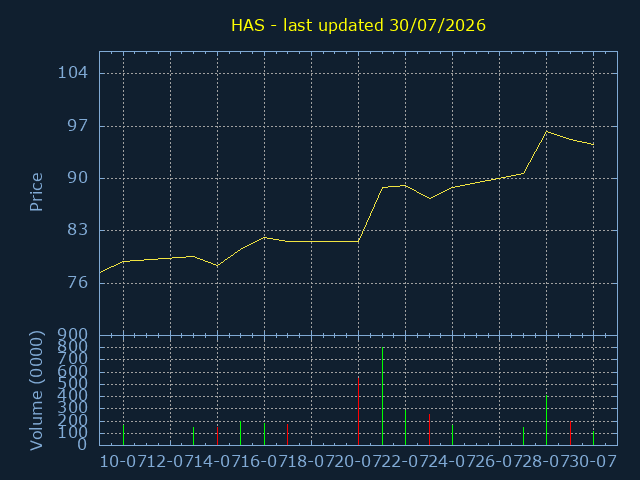
HAS - Hasbro Inc
Sector:
Volume:1,158,442 - vs daily avg (46%)
Current Price:94.53, -0.640, -0.67%
Approx. USD. traded today:1,095,075
Click here for HAS Candlestick History
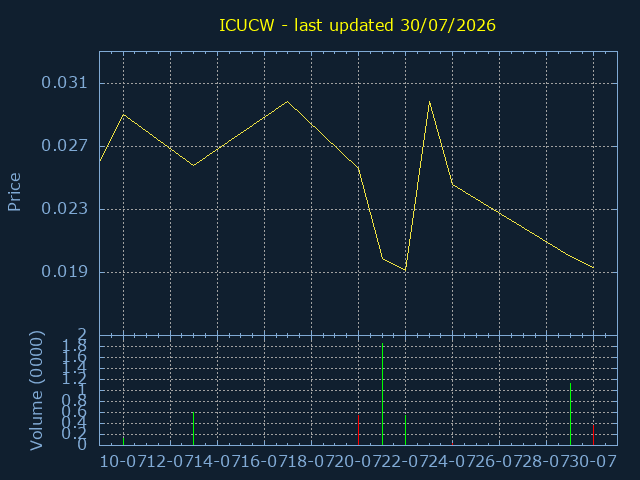
ICUCW - LMF Acquisition Opportunities Inc
Sector:
Volume:3,641 - vs daily avg (11%)
Current Price:0.0193, 0, 0
Approx. USD. traded today:0
Click here for ICUCW Candlestick History
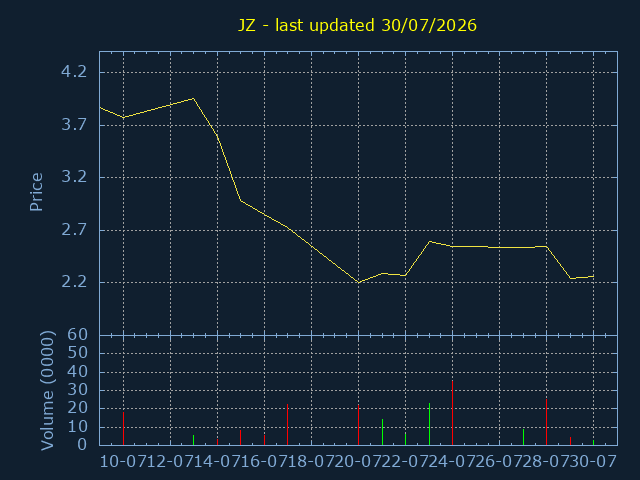
JZ - Jianzhi Education Technology Group Company Limited American Depositary Shares
Sector:
Volume:28,775 - vs daily avg (16%)
Current Price:2.265, +0.025, +0.89%
Approx. USD. traded today:651
Click here for JZ Candlestick History
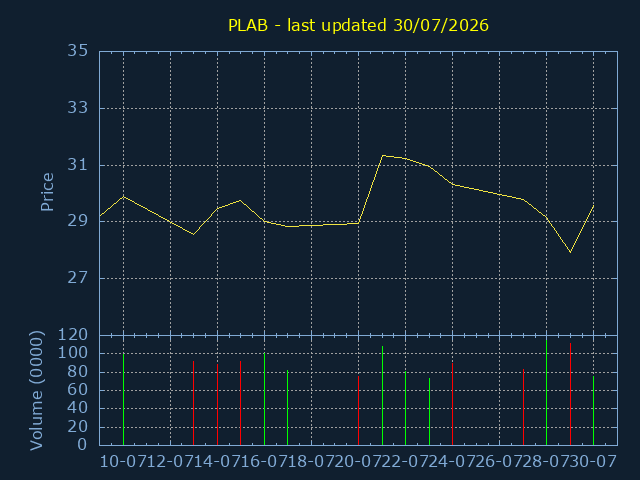
PLAB - Photronics Inc
Sector:
Volume:748,714 - vs daily avg (71%)
Current Price:29.58, +1.640, +5.87%
Approx. USD. traded today:221,469
Click here for PLAB Candlestick History
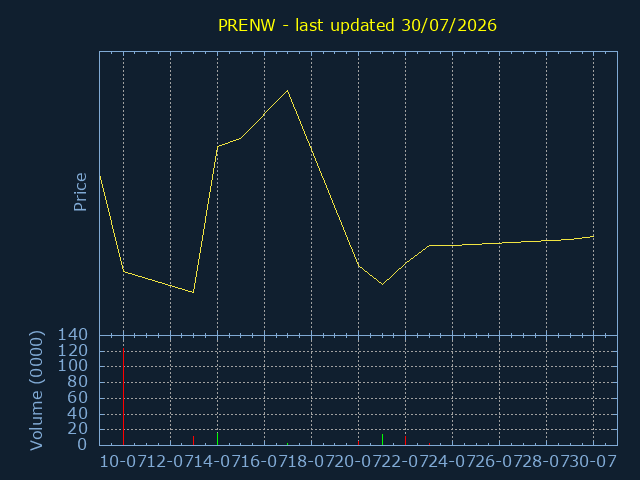
PRENW - Prenetics Holding Company Limited
Sector:
Volume:3,196 - vs daily avg (2%)
Current Price:0.0125, 0, 0
Approx. USD. traded today:0
Click here for PRENW Candlestick History
Copyright © 2023 propatterns.co.uk - All Rights Reserved
Terms And Conditions
Privacy Policy