
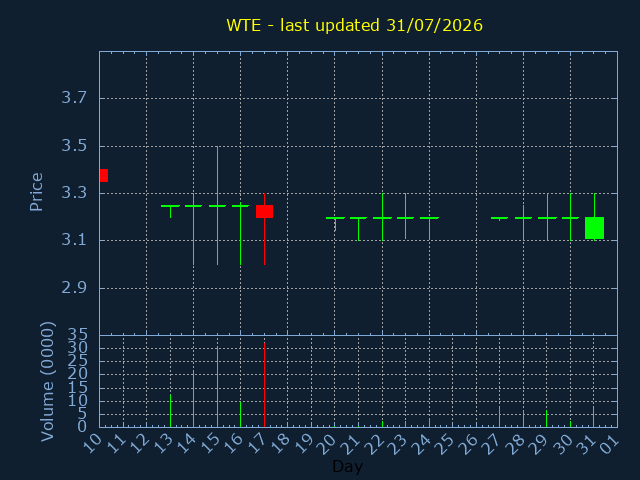
WTE.L
Westmount Energy Limited
SECTOR:Oil & Gas Producers
£2,368 traded on 31/07/2026
| Volume | %Daily avg. |
|---|---|
| 74,009 | 90% |
| OPEN | HIGH |
|---|---|
| 3.11 | 3.3 |
| 200daySMA | 100daySMA |
|---|---|
| 3.794 | 3.553 |
Close:3.2 |
|
|---|---|
|
Change 0 |
%Change 0 |
| LOW | CLOSE |
|---|---|
| 3.1 | 3.2 |
| 50daySMA | 20daySMA |
|---|---|
| 3.505 | 3.438 |
| Date | Pattern | Price | Sign |
|---|---|---|---|
| 05/02/26 | TREND | 5.5 | |
| 06/02/26 | TREND | 5.4 | |
| 09/02/26 | TREND | 5.25 | |
| 10/02/26 | TREND | 5.25 | |
| 05/05/26 | BREAKOUT | 4.2 | |
| 20/05/26 | TREND | 3.8 | |
| 21/05/26 | TREND | 3.8 | |
| 22/05/26 | TREND | 3.8 | |
| 26/05/26 | TREND | 3.8 | |
| 27/05/26 | TREND | 3.7 | |
| 29/05/26 | TREND | 3.7 | |
| 01/06/26 | TREND | 3.7 | |
| 02/06/26 | TREND | 3.7 | |
| 15/07/26 | DCROSS | 3.25 | |
| 31/07/26 | 3MONTH_LOW | 3.2 |