
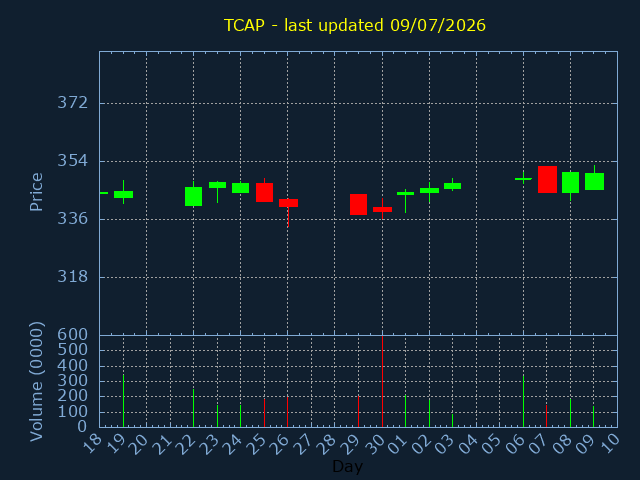
TCAP.L
TP ICAP Group PLC
SECTOR:Financial Services
£4,779,498 traded on 09/07/2026
| Volume | %Daily avg. |
|---|---|
| 1,364,791 | 62% |
| OPEN | HIGH |
|---|---|
| 345.2 | 352.8 |
| 200daySMA | 100daySMA |
|---|---|
| 272.490 | 299.557 |
Close:350.2 |
|
|---|---|
|
Change -0.400 |
%Change -0.11% |
| LOW | CLOSE |
|---|---|
| 345.2 | 350.2 |
| 50daySMA | 20daySMA |
|---|---|
| 333.544 | 360.710 |
| Date | Pattern | Price | Sign |
|---|---|---|---|
| 09/04/26 | GCROSS | 287.2 | |
| 29/04/26 | TRIANGLE | 313.4 | |
| 29/05/26 | TREND | 305.6 | |
| 01/06/26 | TREND | 310 | |
| 02/06/26 | TREND | 309 | |
| 03/06/26 | TREND | 306.6 |