
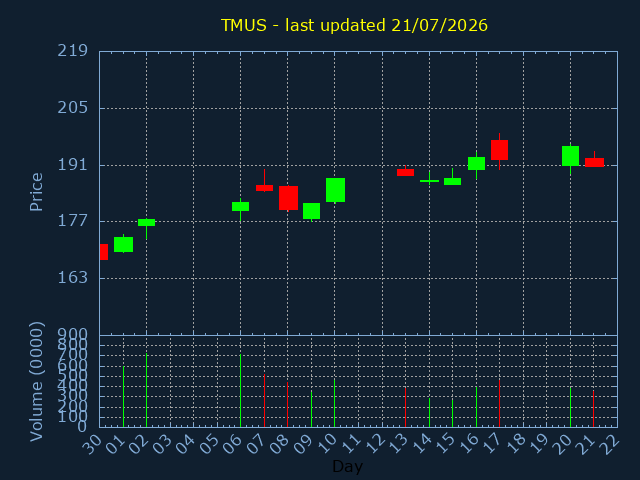
TMUS.US
T-Mobile US Inc
SECTOR:
6,694,502 USD traded on 21/07/2026
| Volume | %Daily avg. |
|---|---|
| 3,509,201 | 66% |
| OPEN | HIGH |
|---|---|
| 192.7 | 194.36 |
| 200daySMA | 100daySMA |
|---|---|
| 200.784 | 196.514 |
Close:190.77 |
|
|---|---|
|
Change -4.870 |
%Change -2.49% |
| LOW | CLOSE |
|---|---|
| 190.589 | 190.77 |
| 50daySMA | 20daySMA |
|---|---|
| 189.118 | 192.172 |
| Date | Pattern | Price | Sign | |
|---|---|---|---|---|
| 20/07/26 | DIVIDEND | 2.04% | EXDIV.28/08 |