
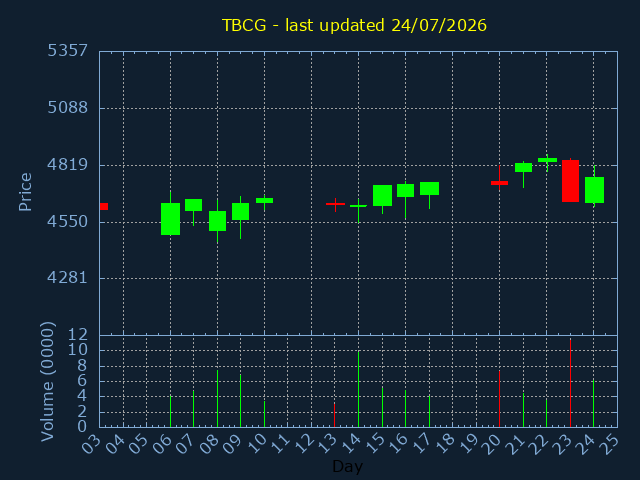
TBCG.L
TBC Bank Group PLC
SECTOR:Banks
£2,915,439 traded on 24/07/2026
| Volume | %Daily avg. |
|---|---|
| 61,223 | 78% |
| OPEN | HIGH |
|---|---|
| 4644 | 4816 |
| 200daySMA | 100daySMA |
|---|---|
| 4259.516 | 4520.216 |
Close:4762 |
|
|---|---|
|
Change +114 |
%Change +2.45% |
| LOW | CLOSE |
|---|---|
| 4624.4 | 4762 |
| 50daySMA | 20daySMA |
|---|---|
| 4613.268 | 4866.200 |
| Date | Pattern | Price | Sign | |
|---|---|---|---|---|
| 20/02/26 | BREAKOUT | 4665 | ||
| 06/03/26 | GCROSS | 4315 | ||
| 09/03/26 | TREND | 4205 | ||
| 10/03/26 | TREND | 4475 | ||
| 11/03/26 | TREND | 4385 | ||
| 12/03/26 | TREND | 4255 | ||
| 13/03/26 | TREND | 4210 | ||
| 16/03/26 | TREND | 4180 | ||
| 17/03/26 | TREND | 4225 | ||
| 18/03/26 | TREND | 4215 | ||
| 19/03/26 | TREND | 4085 | ||
| 20/03/26 | TREND | 4015 | ||
| 23/03/26 | TREND | 4100 | ||
| 24/03/26 | TREND | 4140 | ||
| 08/07/26 | DIVIDEND | 0% | EXDIV.13/08 | |
| 15/07/26 | TRIANGLE | 4722 |