
SBRE.L
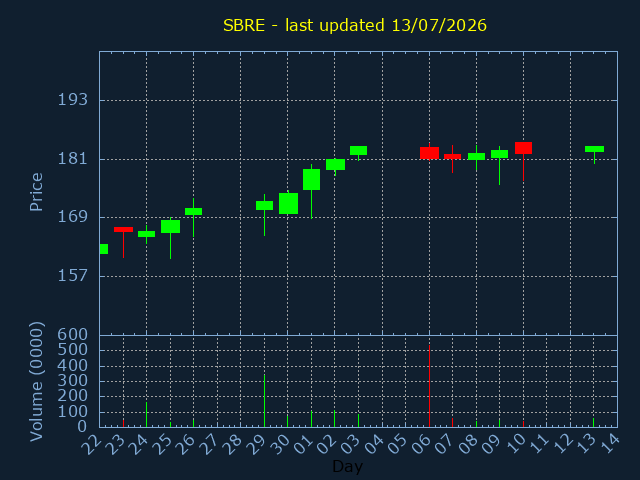
Sabre Insurance Group plc
SECTOR:Insurance (non-life)
£1,099,382 traded on 13/07/2026
| Volume | %Daily avg. |
|---|---|
| 598,792 | 60% |
| OPEN | HIGH |
|---|---|
| 182.6 | 183.6 |
| 200daySMA | 100daySMA |
|---|---|
| 137.847 | 152.991 |
Close:183.6 |
|
|---|---|
|
Change +1.400 |
%Change +0.77% |
| LOW | CLOSE |
|---|---|
| 180.03 | 183.6 |
| 50daySMA | 20daySMA |
|---|---|
| 164.588 | 181.010 |
| Date | Pattern | Price | Sign |
|---|---|---|---|
| 05/02/26 | TREND | 131 | |
| 06/02/26 | TREND | 131 | |
| 09/02/26 | TREND | 130.8 | |
| 10/02/26 | TREND | 129.4 | |
| 19/02/26 | BREAKOUT | 135.6 | |
| 19/03/26 | GCROSS | 163.2 | |
| 16/04/26 | TRIANGLE | 164.6 | |
| 07/05/26 | TREND | 149.4 | |
| 08/05/26 | TREND | 149 | |
| 11/05/26 | TREND | 150 | |
| 12/05/26 | TREND | 148.6 | |
| 13/05/26 | TREND | 149 | |
| 14/05/26 | TREND | 150 | |
| 15/05/26 | TREND | 152 | |
| 18/05/26 | TREND | 154.4 | |
| 19/05/26 | TREND | 155 |