
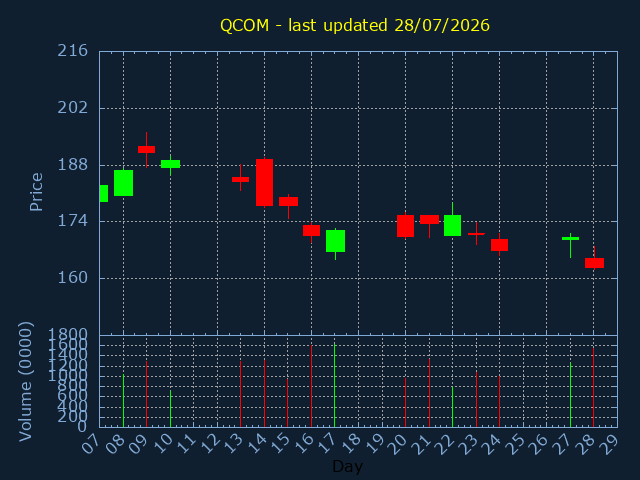
QCOM.US
Qualcomm Incorporated
SECTOR:
25,055,382 USD traded on 28/07/2026
| Volume | %Daily avg. |
|---|---|
| 15,382,725 | 109% |
| OPEN | HIGH |
|---|---|
| 164.896 | 167.885 |
| 200daySMA | 100daySMA |
|---|---|
| 168.788 | 175.299 |
Close:162.88 |
|
|---|---|
|
Change -7.160 |
%Change -4.21% |
| LOW | CLOSE |
|---|---|
| 162.16 | 162.88 |
| 50daySMA | 20daySMA |
|---|---|
| 206.186 | 188.368 |
| Date | Pattern | Price | Sign | |
|---|---|---|---|---|
| 24/02/26 | BREAKOUT | 144.78 | ||
| 04/03/26 | DCROSS | 139.51 | ||
| 24/04/26 | BREAKOUT | 148.85 | ||
| 27/05/26 | GCROSS | 233.4 | ||
| 27/07/26 | DIVIDEND | 2.08% | EXDIV.03/09 |