
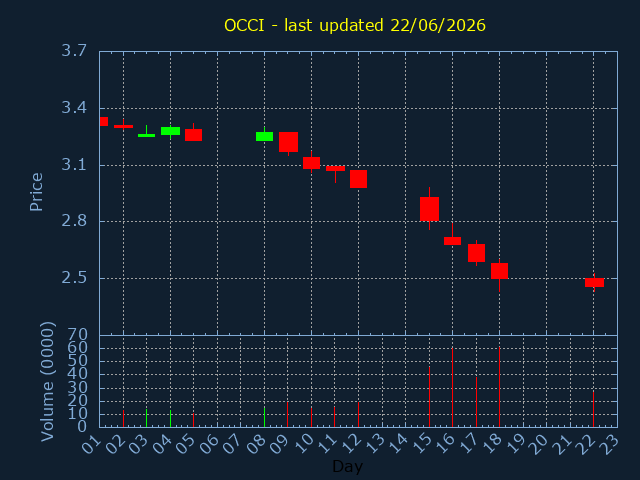
OCCI.US
OFS Credit Company Inc
SECTOR:
6,495 USD traded on 22/06/2026
| Volume | %Daily avg. |
|---|---|
| 264,060 | 116% |
| OPEN | HIGH |
|---|---|
| 2.5 | 2.525 |
| 200daySMA | 100daySMA |
|---|---|
| 3.761 | 3.163 |
Close:2.46 |
|
|---|---|
|
Change -0.040 |
%Change -1.60% |
| LOW | CLOSE |
|---|---|
| 2.43 | 2.46 |
| 50daySMA | 20daySMA |
|---|---|
| 3.152 | 3.250 |
| Date | Pattern | Price | Sign | |
|---|---|---|---|---|
| 27/04/26 | BREAKOUT | 3.03 | ||
| 01/05/26 | DIVIDEND | 45.85% | EXDIV.15/05 | |
| 22/06/26 | 3MONTH_LOW | 2.46 | ||
| 22/06/26 | 1YEAR_LOW | 2.46 |