
NG.L
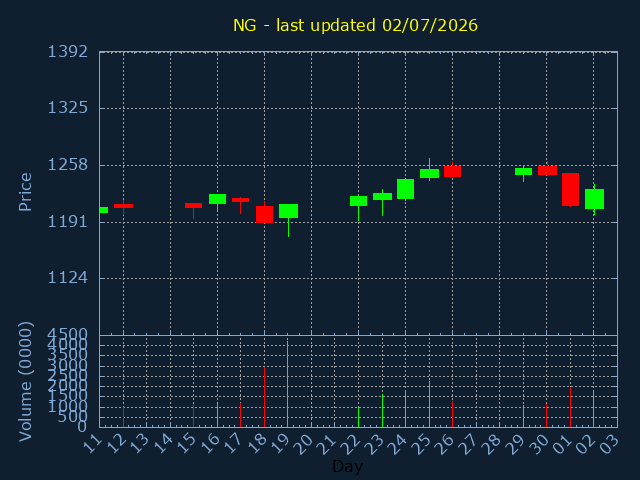
National Grid plc
SECTOR:Gas & Water
£211,637,920 traded on 02/07/2026
| Volume | %Daily avg. |
|---|---|
| 17,206,335 | 116% |
| OPEN | HIGH |
|---|---|
| 1207.5 | 1235.5 |
| 200daySMA | 100daySMA |
|---|---|
| 1187.471 | 1271.809 |
Close:1230 |
|
|---|---|
|
Change +19 |
%Change +1.57% |
| LOW | CLOSE |
|---|---|
| 1200.4495 | 1230 |
| 50daySMA | 20daySMA |
|---|---|
| 1254.573 | 1279.225 |
| Date | Pattern | Price | Sign |
|---|---|---|---|
| 12/03/26 | TREND | 1368 | |
| 13/03/26 | TREND | 1373.5 | |
| 16/03/26 | TREND | 1356 | |
| 18/03/26 | TREND | 1321 | |
| 19/03/26 | TREND | 1272 | |
| 20/03/26 | TREND | 1233 | |
| 23/03/26 | TREND | 1211 | |
| 24/03/26 | TREND | 1232 | |
| 25/03/26 | TREND | 1262 | |
| 27/03/26 | TREND | 1236.5 |