
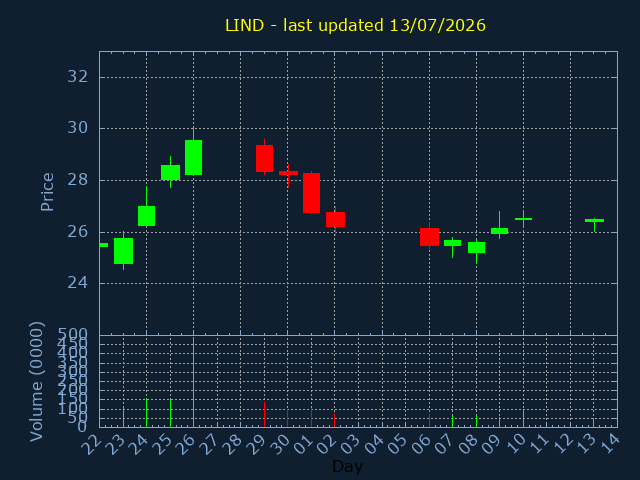
LIND.US
Lindblad Expeditions Holdings Inc
SECTOR:
129,742 USD traded on 13/07/2026
| Volume | %Daily avg. |
|---|---|
| 489,781 | 46% |
| OPEN | HIGH |
|---|---|
| 26.4 | 26.55 |
| 200daySMA | 100daySMA |
|---|---|
| 17.366 | 20.861 |
Close:26.49 |
|
|---|---|
|
Change -0.030 |
%Change -0.11% |
| LOW | CLOSE |
|---|---|
| 26.03 | 26.49 |
| 50daySMA | 20daySMA |
|---|---|
| 23.076 | 27.075 |
| Date | Pattern | Price | Sign |
|---|---|---|---|
| 05/02/26 | TRIANGLE | 18.28 | |
| 06/03/26 | TREND | 17.84 |