
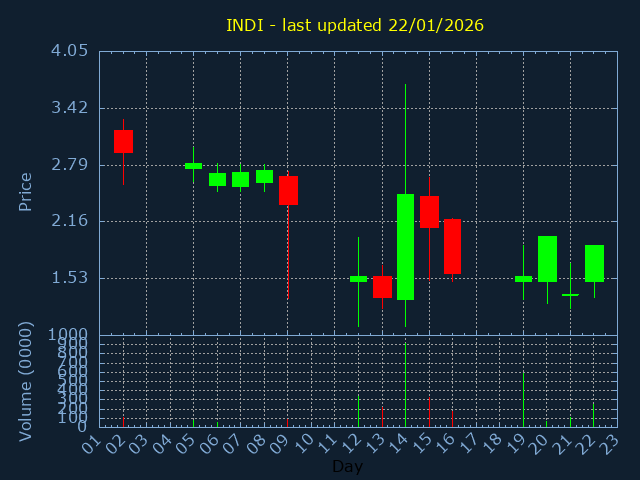
INDI.L
Indus Gas Limited
SECTOR:Oil & Gas Producers
£48,142 traded on 22/01/2026
| Volume | %Daily avg. |
|---|---|
| 2,533,816 | 133% |
| OPEN | HIGH |
|---|---|
| 1.5 | 1.9 |
| 200daySMA | 100daySMA |
|---|---|
| 8.749 | 8.911 |
Close:1.9 |
|
|---|---|
|
Change +0.540 |
%Change +39.71% |
| LOW | CLOSE |
|---|---|
| 1.32 | 1.9 |
| 50daySMA | 20daySMA |
|---|---|
| 7.025 | 3.073 |
| Date | Pattern | Price | Sign |
|---|---|---|---|
| 05/01/26 | DCROSS | 2.805 |