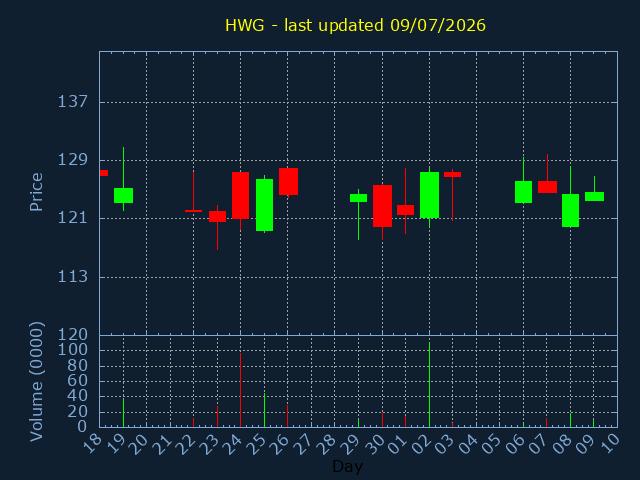
flagImg

HWG.L

Harworth Group plc

SECTOR:Real Estate Investment & Services


£425,789 traded on 02/10/2025

Volume %Daily avg.
251,203 87%
OPEN HIGH
172 172.7
200daySMA 100daySMA
172.381 178.144
Close:169.5

Change

-1

%Change

-0.59%
LOW CLOSE
169.5 169.5
50daySMA 20daySMA
180.045 178.844
chartImg
Date Pattern Price Sign
12/08/24TREND170
13/08/24TREND170
14/08/24TREND163
12/09/24BREAKOUT175
13/09/24DIVIDEND0.88%EXDIV.19/09
14/10/24TREND182.5
15/10/24TREND181.5
16/10/24TREND182.5
17/10/24TREND179
18/10/24TREND180
21/10/24TREND179
22/10/24TREND176.5
25/10/24BREAKOUT186
28/02/25TREND161
03/03/25TREND162
17/03/25DCROSS166.5
30/04/25GCROSS175
14/05/25TREND170
15/05/25TREND172
16/05/25TREND170
19/05/25TREND174
20/05/25BREAKOUT179.5
13/06/25BREAKOUT176
08/08/25TREND182
11/08/25TREND181
12/08/25TREND181
13/08/25TREND181.5
14/08/25TREND181.5
15/08/25TREND180
18/08/25TREND178
19/08/25TREND174.5
21/08/25TREND175.5
22/08/25TREND176
26/08/25TREND175.5
27/08/25TREND177
02/10/253MONTH_LOW169.5

Copyright © 2023 propatterns.co.uk - All Rights Reserved