
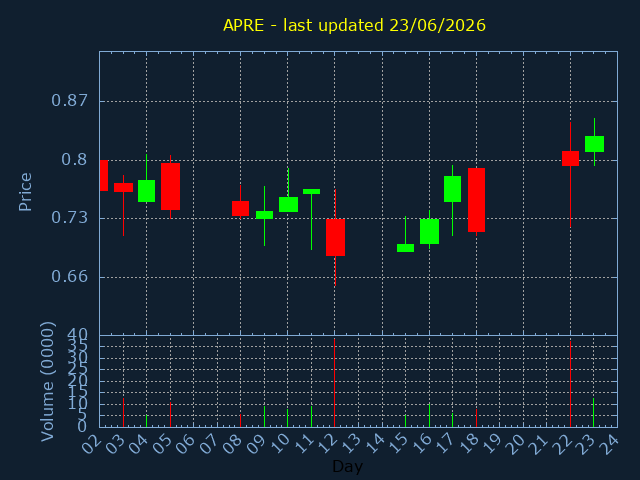
APRE.US
Aprea Therapeutics Inc
SECTOR:
1,028 USD traded on 23/06/2026
| Volume | %Daily avg. |
|---|---|
| 124,214 | 94% |
| OPEN | HIGH |
|---|---|
| 0.81 | 0.8498 |
| 200daySMA | 100daySMA |
|---|---|
| 1.017 | 0.807 |
Close:0.828 |
|
|---|---|
|
Change +0.034 |
%Change +3.78% |
| LOW | CLOSE |
|---|---|
| 0.794 | 0.828 |
| 50daySMA | 20daySMA |
|---|---|
| 0.867 | 0.839 |
| Date | Pattern | Price | Sign |
|---|---|---|---|
| 19/03/26 | TREND | 0.7635 |