
How does the site work?
The site analyses the price and volume data of all U.K stocks each trading day.
The open price (O), the highest price of the day (H), the lowest price of the day (L), the close price (C) and the volume traded (V) are all analysed and compared to the previous 3 years.
What do we look for?
We are looking for trends and share price movement we can take advantage of. These are some of the patterns we look for. We do not look at company fundamentals.
Nothing moves up in a straight line. The share price of each and every stock moves up and down.
Part of what we do is identifying stocks at recent lows where previous price movements were favourable.
This could be stocks at a 3 yr low, 2 yr low or 1 yr low. Stocks trading at the bottom of a 3 month range or stocks trending upwards but showing a recent pullback in price.
We also look for candlestick patterns known as Dojis.
This is part of what we search for to help our investing decisions. We search for many more patterns besides that. We perform volume analysis and also look at moving averages.
When we have all this information at our fingertips we can look into a stock further.
Let’s take a look at how we may use the site
I set an email alert in the my watchlist control panel to receive an email if a company is at 3 month low, has shown prices ranging between two points and has shown high volume activity.
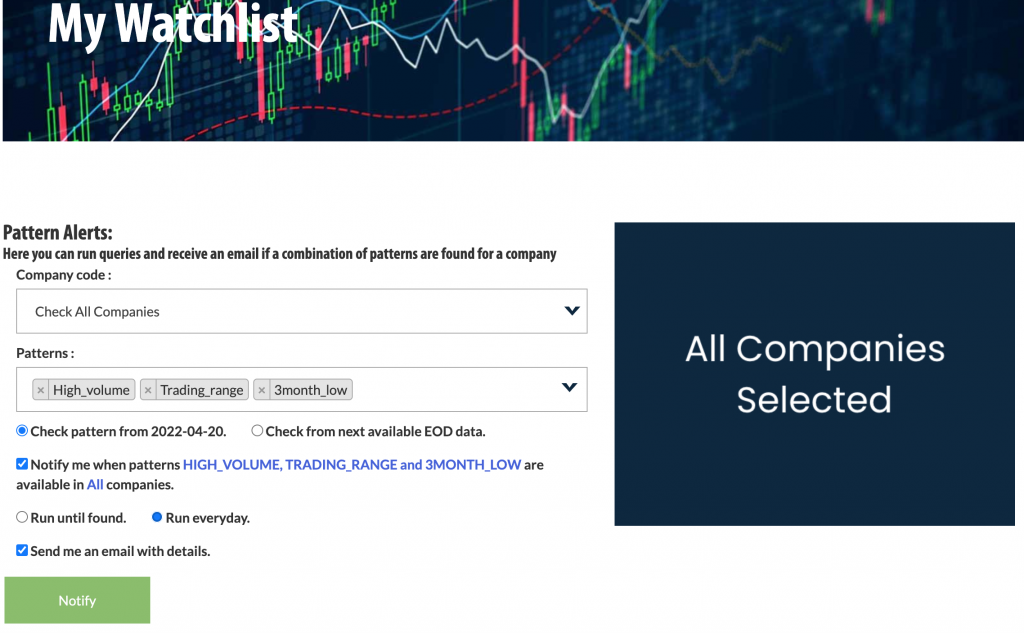
The result of that query returned DPH.
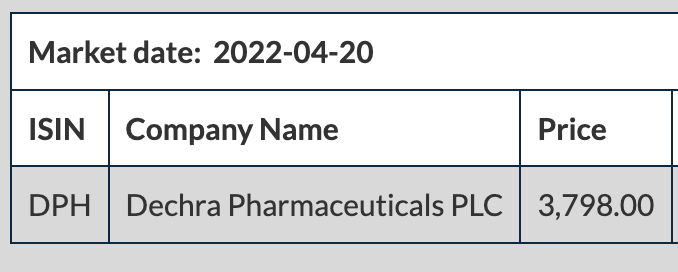
Let’s look into DPH a bit further.
Trading Range
DPH’s share price has ranged between 3761 and 4289 during the last few months. This was highlighted on the trading range pattern page and clicking on the link shows us it is a possible contender where, if the previous pattern is repeated we could make 14%. It seems the support and resistance has been well defined during the past 3 months. There is even an ascending triangle pattern present too.
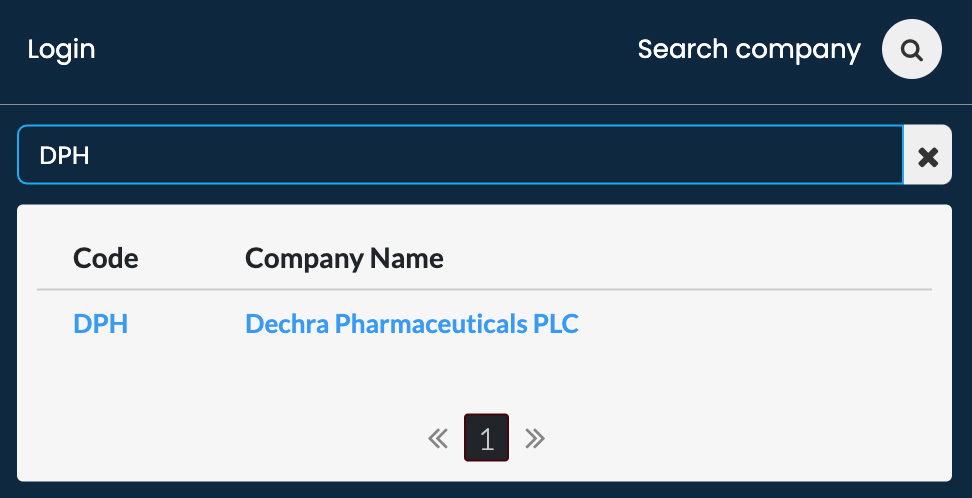
Clicking on the search bar at the top right of the site we can see more information on DPH.
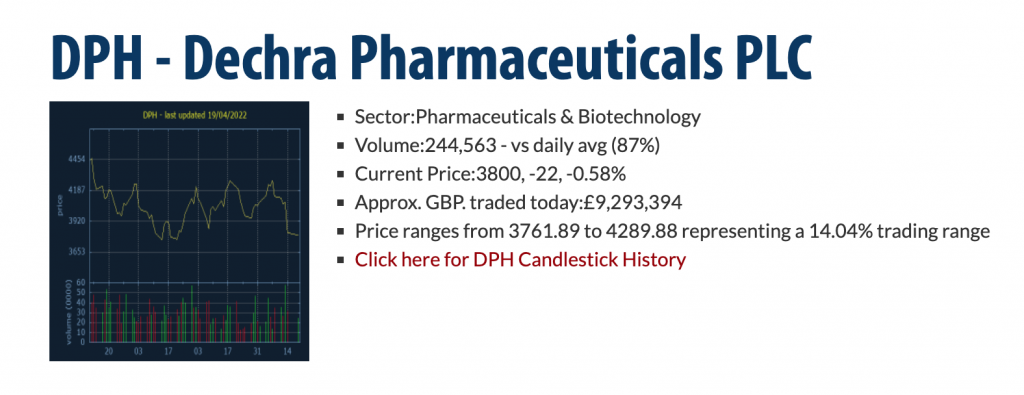
Clicking on this link brings up the candlestick graph and more information for DPH.
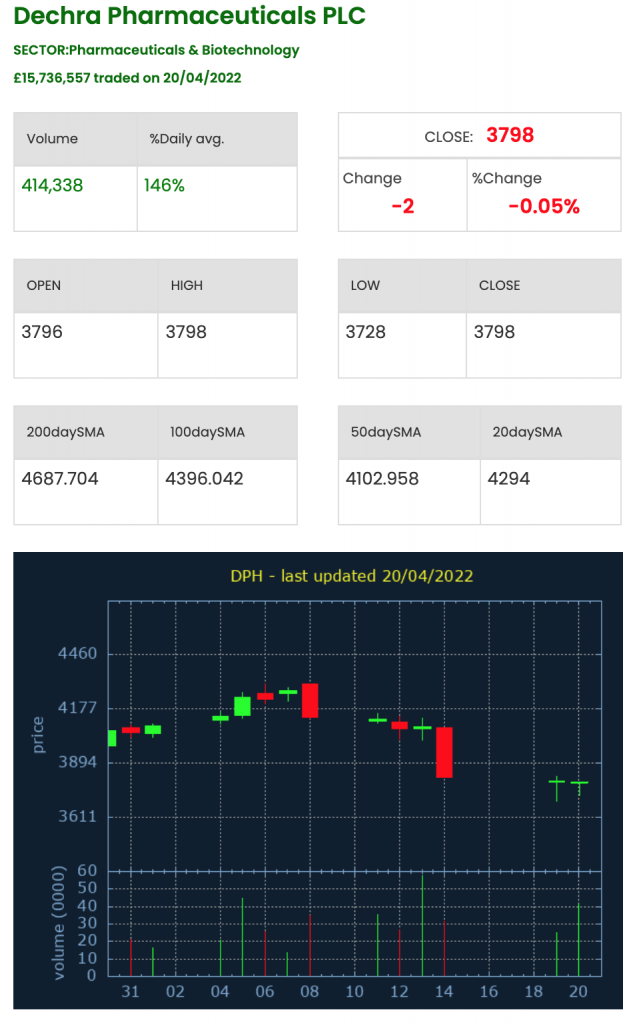
We can see that today’s volume was unusually high at 146% and was highlighted in the high volume pattern page. Over 15 Million pounds worth of DPH shares were traded that day when usually 10 Million are traded.
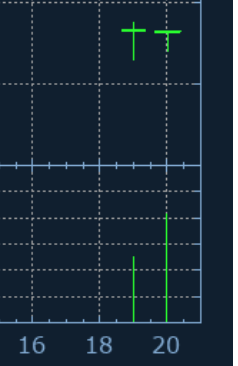
The last two candlestick patterns show the beginning of a short term triangle forming which indicates a short term move higher is possible. During the last two days there has been increased trading activity, the close price has remained largely stable and the low price has increased. The next day’s trading activity may confirm this pattern.
The next day’s trading activity shows the short term triangle pattern not to be confirmed. The sellers tipped the balance and the share price closed down on the day.
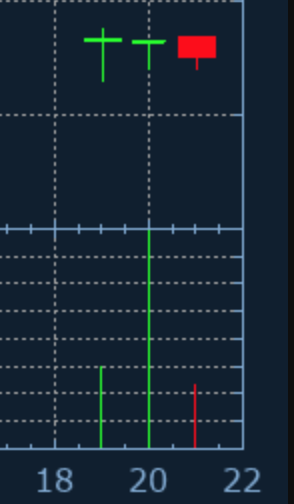
Although there is heightened interest in the stock at these levels we will await the 1 year low of 3672 for possible entry as the bears are currently overpowering the bulls.
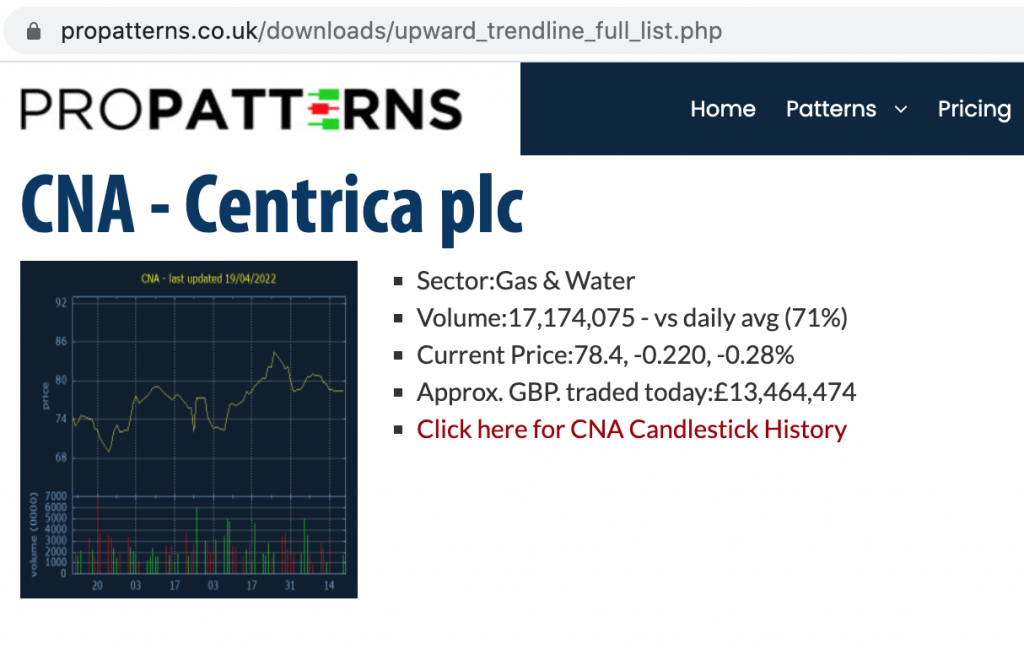
Stocks trending higher
CNA – Centrica ‘s upward trendline identified by the upward trendline pattern allows us to pick up some Centrica shares slightly cheaper during a recent price pullback.
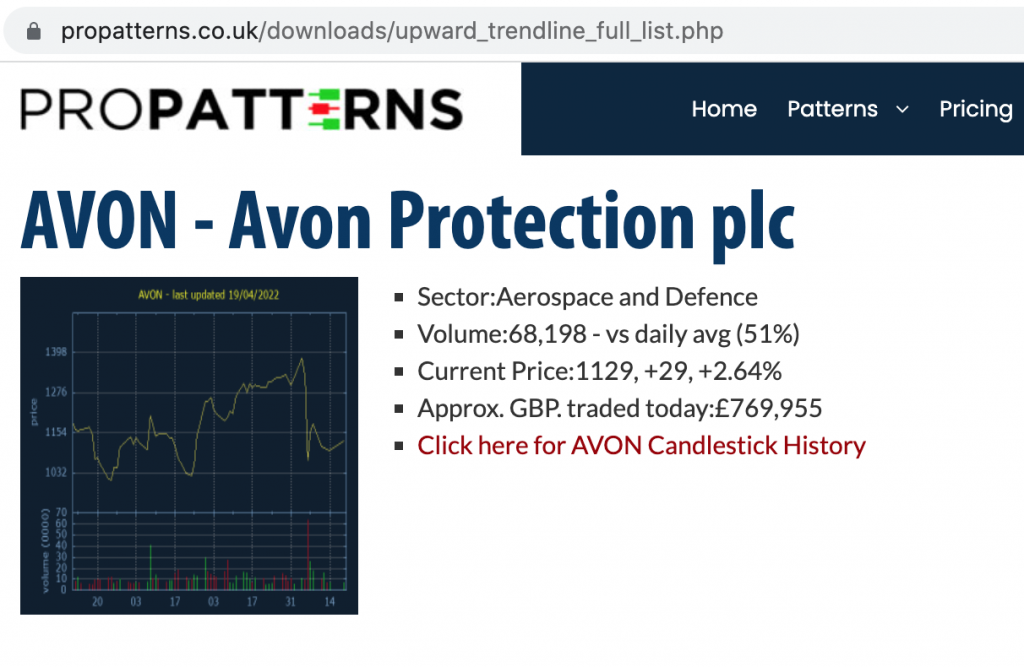
AVON Protection is showing the same upward trendline pattern with recent price pullback too. There is some support at 1032.
These are some of the patterns we can use to improve our investment returns and reduce our risk.
Sign up for free to browse this site and improve your investing.

Trading Range
This algorithm identifies stocks that have traded horizontally within a defined range of at least 9% over the last three months. It lists stock where the price is currently at the bottom of that trading range.
Upward Trendlines
Three months data is displayed. Stocks that show an upward trending channel over the last 6 weeks are listed.
Ascending Triangles
The ascending triangle is a bullish continuation pattern. It is indicative of increased buying pressure. The rising lower trendline provides cheap entry points before the pattern completes and a breakout occurs.
High Volume
Today’s volume is compared to the average daily volume over the last month. This algorithm can highlight the trading activity of large institutional investors days before a TR-1:Notification of major holdings RNS is released.
Breakout
Following a period of consolidation and relatively low trading activity, this algorithm detects an upside breakout and renewed interest in a stock. This algorithm regularly detects breakouts of 50% and more.
Doji
Highlighting indecision, the Doji candlestick pattern often precedes a price reversal. It can be used with the trading range and upward trendline algorithms to time entry and exit points.
No comments yet